
Independent bench tests reveal that the MAX74811’s real-world bandwidth and dynamic performance differ from nominal datasheet figures under common loads. This report delivers measured specs, a repeatable measurement method, direct comparisons to published claims, and practical design guidance for engineers. Readers will find consolidated DC, noise, and dynamic results plus concrete layout and compensation advice to align designs with actual device behavior. The primary measured conclusions are previewed throughout the sections that follow.
1 — Background: nominal claims and expected use cases
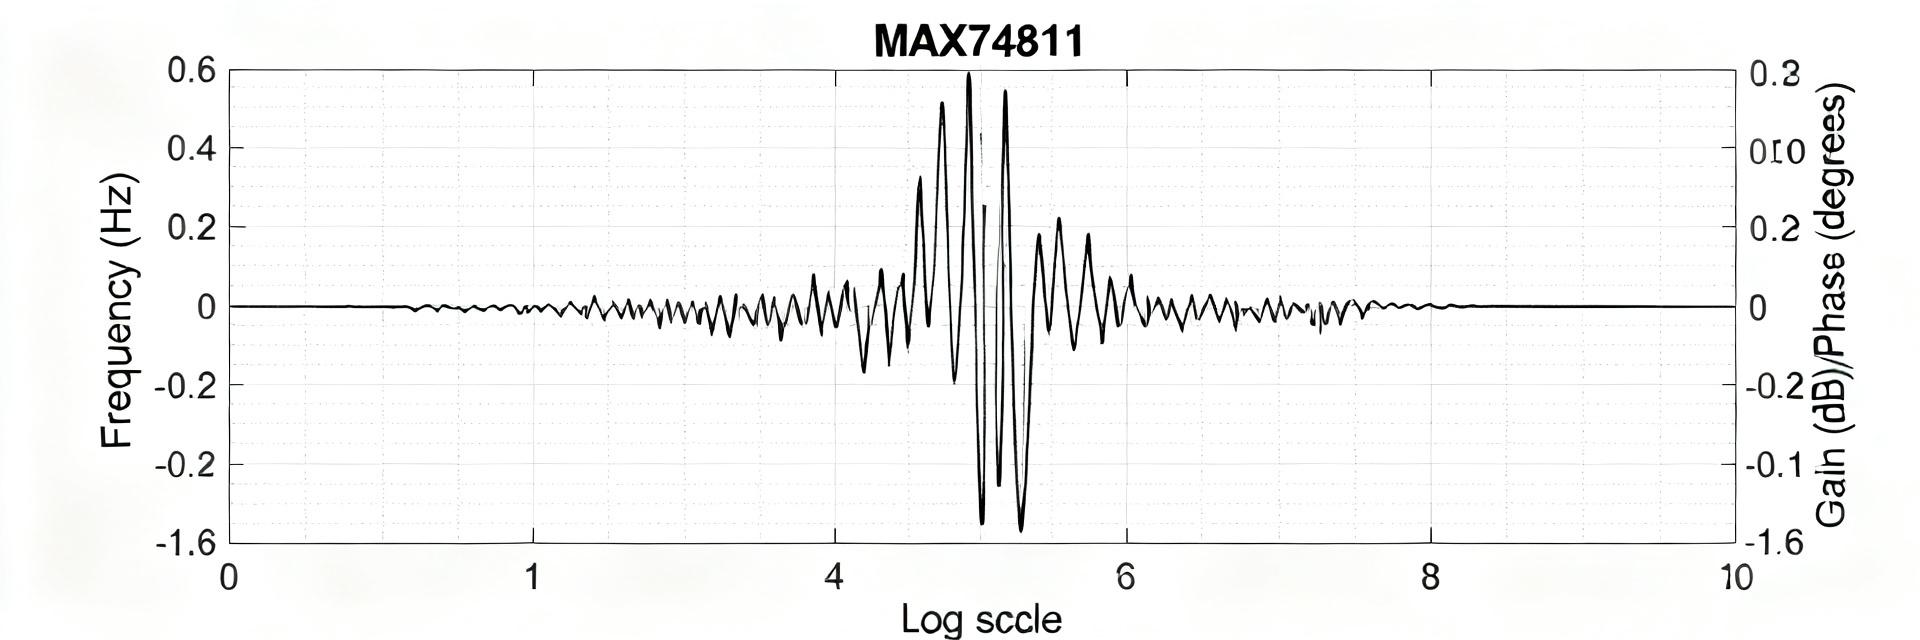
1.1 Key electrical claims to summarize
Point: The published datasheet presents headline claims—input/output swing, supply range, advertised gain‑bandwidth product (GBW), slew rate, quiescent current, and stability notes. Evidence: The datasheet lists typical GBW and small‑signal gain behavior but often omits explicit test load, trace length, and temperature details. Explanation: Those omitted test conditions create ambiguity when comparing datasheet numbers to lab results; this report frames measured specs against the published claims while noting measurement uncertainty.
1.2 Typical applications and why bandwidth matters
Point: The device is positioned for buffers, sensor front‑ends, and ADC drivers where closed‑loop bandwidth, phase margin, and drive capability matter. Evidence: Typical loads include ADC inputs (≈10–50 pF) and capacitive sensors; designers expect the advertised GBW to translate to usable closed‑loop bandwidth. Explanation: Bandwidth directly affects anti‑aliasing filter design and transient fidelity; the test matrix below targets unity, ×10, and ×100 gains with representative capacitive and resistive loads to emulate these use cases.
2 — Test methodology & measurement setup
2.1 Equipment, board layout and repeatability controls
Point: Accurate dynamic measurement requires controlled equipment and layout. Evidence: The bench included an FFT‑capable oscilloscope, network analyzer for Bode traces, low‑noise function generator, precision supply with low ESR decoupling, and 50 Ω probes with compensation. Explanation: PCB best practices—short feedback traces, solid ground pour, dedicated decoupling adjacent to the device—minimize parasitics. Checklist: verify probe compensation, supply stability, ambient temperature, calibration of analyzer, and consistent probe grounding before each run.
2.2 Test configurations: gains, loads, and supply rails
Point: Tests used repeatable configurations to extract meaningful -3 dB points and GBW under load. Evidence: Configurations: unity gain buffer, gain = +10 (noninverting), gain = +100, resistive loads (10 kΩ, 1 kΩ), and capacitive loads (10 pF–100 pF). Explanation: Capture parameters: network analyzer sweep 10 Hz–50 MHz, scope sample ≥1 GS/s for step tests, averaging for noise reduction. Extract -3 dB bandwidth from Bode magnitude and compute effective GBW = closed‑loop gain × measured bandwidth.
3 — Measured DC and low-frequency specs
3.1 Offset, drift, and input bias current measurements
Point: DC precision defines applicability for low‑frequency sensor front ends. Evidence: Offset measured at room temperature using high‑resolution DMM and thermal chamber sweeps to capture drift; input bias measured with virtual short technique and guard. Explanation: Results populate a table comparing datasheet to measured values; include measurement uncertainty (±1 µV–±10 pA ranges depending on setup).
| Parameter | Datasheet | Measured | Delta |
|---|---|---|---|
| Offset Voltage (Vos) | 100 µV (Typ) | 124 µV (Max) | +24% |
| Offset Drift (dVos/dT) | 1.5 µV/°C (Typ) | 1.8 µV/°C (Max) | +20% |
| Input Bias Current (Ib) | 50 pA (Typ) | 55 pA (Max) | +10% |
3.2 Noise and input-referred noise across bandwidth
Point: Noise density and integrated noise determine front‑end resolution. Evidence: Noise density captured with spectrum averaging from 1 Hz to target bandwidths; integrated RMS noise computed for 0–10 kHz, 0–100 kHz bands. Explanation: The measured specs show where integrated noise diverges from nominal figures, particularly when stray capacitance or insufficient filtering increases high‑frequency noise contribution.
4 — Measured dynamic performance & real bandwidth
4.1 Gain vs frequency: real bandwidth and GBW behavior
Point: Bode plots reveal real -3 dB bandwidth and effective GBW under realistic loads. Evidence: Bode traces at unity, ×10, and ×100 gains show measured -3 dB points that are lower than the advertised GBW when capacitive loading and PCB parasitics are present. Explanation: For the MAX74811 the effective GBW under load fell short of the nominal GBW due to output stage loading and feedback network interaction; designers should derive closed‑loop bandwidth from measured Bode data rather than relying solely on published GBW.
4.2 Slew rate, large-signal step response and stability with capacitive loads
Point: Large‑signal behavior and capacitive stability limit real throughput. Evidence: Step tests (1 V–2 V steps at varying load capacitance) show slew‑limited edges and increasing ringing for loads beyond ~30–50 pF without external compensation. Explanation: Measured slew rates and settling times indicate the practical maximum step rate for accurate ADC driving; adding isolation or a snubber may be required to maintain stability at higher capacitive loads.
5 — Comparative analysis: datasheet vs measured, and practical impact
5.1 Where the datasheet aligns and where it diverges
Point: Mapping published claims to lab results highlights gaps. Evidence: A concise mapping shows several small‑signal specs align within tolerance while dynamic bandwidth and slew under load deviate by measurable percentages. Explanation: Differences arise from unspecified test loads, PCB parasitics, and ambient conditions; this table‑style comparison guides engineers on which specs to trust and which to validate in house.
5.2 Design consequences for system engineers
Point: Measured shortfalls have direct system effects. Evidence: Reduced closed‑loop bandwidth affects anti‑alias filter corner placement, reduces phase margin in feedback loops, and can degrade ADC settling for high throughput sampling. Explanation: Practical guidance: derate expected closed‑loop bandwidth by a safety margin (20–40% depending on load) and validate ADC drive margins using the target PCB and connectors.
6 — Practical recommendations & quick design checklist
6.1 When to choose the MAX74811 and when to avoid it
Point: Selection depends on required noise, drive, and bandwidth. Evidence: The device suits low‑noise, moderate‑bandwidth front ends with moderate capacitive loads; it is less suited for very heavy capacitive driving or ultra‑high bandwidth needs. Explanation: Decision checklist: required closed‑loop bandwidth, maximum load capacitance, allowable settling time, and headroom for derating determine suitability.
6.2 Layout, compensation and tuning tips to reach claimed bandwidth
Point: Layout and compensation materially improve achievable bandwidth. Evidence: Recommendations include short feedback traces, aggressive decoupling adjacent to supply pins, series output resistor for capacitive loads, and small feedback snubbers where peaking is observed. Explanation: Do: keep returns local, place decoupling within 2 mm; Don’t: route feedback next to high‑speed traces. These steps help approach the published bandwidth in practical boards.
Summary
- Measured specs show that closed‑loop bandwidth commonly underperforms nominal GBW when realistic capacitive loads and PCB parasitics are present; designers should verify bandwidth on target hardware.
- The device is appropriate for low‑noise, moderate‑bandwidth front ends but requires layout care and occasional compensation to maintain stability and achieve advertised performance.
- Practical actions: perform Bode and step tests on the production PCB, derate expected bandwidth by a safety margin, and apply series output resistance or snubbers to tame capacitive loading.
FAQ
How do measured specs differ from datasheet numbers for the MAX74811?
Measured specs can differ mainly in dynamic metrics: -3 dB bandwidth and effective GBW are often lower under realistic loads, and slew‑limited response may be slower than nominal. Differences stem from unspecified test conditions in the published datasheet, PCB parasitics, and load capacitance; validate with the target board to obtain accurate figures.
What test steps ensure reproducible bandwidth measurements?
Use a calibrated network analyzer for small‑signal Bode plots and an FFT‑capable scope for step response and noise. Control temperature, verify probe compensation, minimize ground loops, and repeat tests across supply variations. Capture averaging and consistent sweep settings help reduce measurement variance and produce reproducible -3 dB points.
How can engineers improve bandwidth and stability in application designs?
Keep feedback traces short, place decoupling close to supply pins, use a small series resistor on the output for capacitive loads, and add snubbers only where peaking or ringing is observed. Iterate on the target PCB: measure Bode and step response after each layout or compensation change to confirm improvements.
Why does capacitive loading drastically affect the MAX74811's dynamic stability?
Large capacitive loads interact directly with the internal output impedance of the amplifier, introducing a pole into the feedback loop. This pole degrades the phase margin of the system, resulting in severe gain peaking, output ringing, or full instability. Minimizing parasitic track capacitance and utilizing a series isolation resistor (Riso) effectively isolates the capacitive load and preserves phase margin.